使用 Prometheus 和 Grafana 来监测 django 应用
作者: Ju4t
django 应用配置
pip install django-prometheus
settings.py
INSTALLED_APPS = [
   ...
   'django_prometheus',
   ...
]

MIDDLEWARE = [
    'django_prometheus.middleware.PrometheusBeforeMiddleware',
    # All your other middlewares go here, including the default
    # middlewares like SessionMiddleware, CommonMiddleware,
    # CsrfViewmiddleware, SecurityMiddleware, etc.
    'django_prometheus.middleware.PrometheusAfterMiddleware',
]
urls.py
urlpatterns = [
    ...
    path('', include('django_prometheus.urls')),
]
models.py
from django_prometheus.models import ExportModelOperationsMixin

class Article(ExportModelOperationsMixin('article'), models.Model):
    """
    文章
    """
    ...
验证:http://localhost:8000/metrics
更多设置:缓存命中率,模型设置 参考
https://pypi.org/project/django-prometheus/
部署 Prometheus 和 Grafana
version: '2'
services:
    prometheus:
        image: prom/prometheus
        volumes:
           - ./prometheus.yml:/etc/prometheus/prometheus.yml
        command:
           - '--config.file=/etc/prometheus/prometheus.yml'
        ports:
           - 9090:9090
    grafana:
        image: grafana/grafana
        ports:
           - 3000:3000
prometheus.yml
global:
   scrape_interval: 15s
   evaluation_interval: 30s
rule_files:
scrape_configs:
- job_name: django
#  metrics_path: /metrics
  static_configs:
      - targets:
          - 192.168.8.3:8000
        labels:
          app: 'blog'
验证:
- http://localhost:9090/ 搜索 django... 验证是否有相关数据,没有的话检查设置,Docker部署时建议使用IP,而不是localhost
- http://localhost:3000/ 默认账号密码:admin
设置
- 在 Grafana 添加 DataSource,http://192.168.8.3:9090/
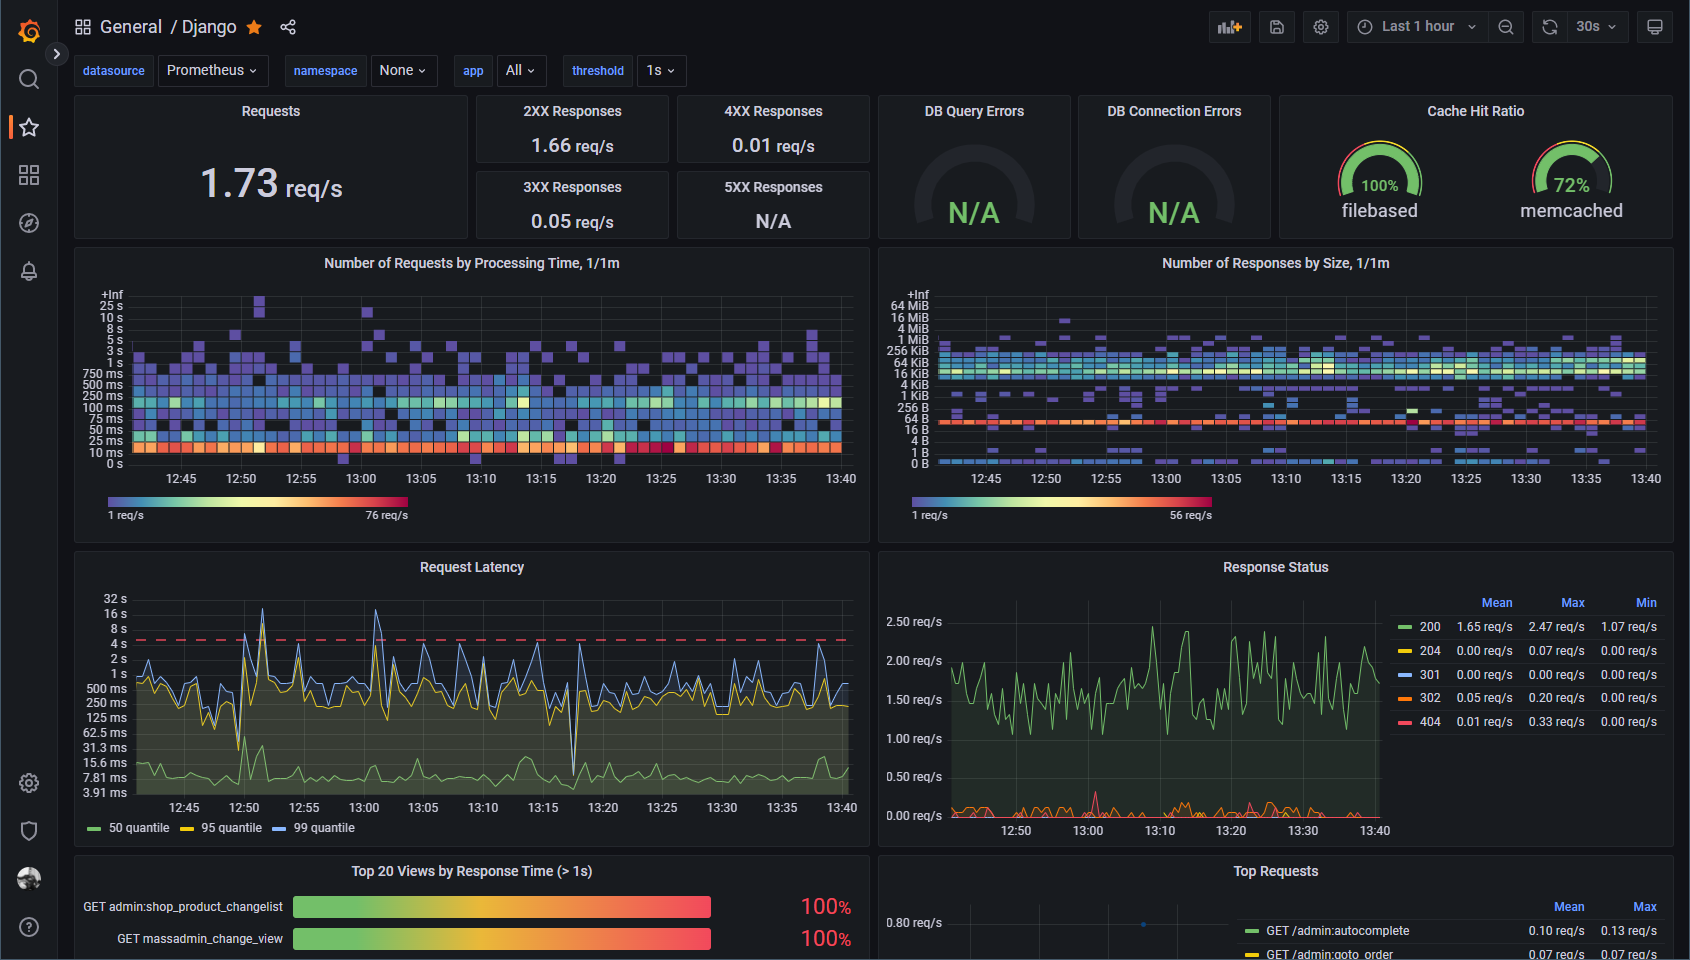
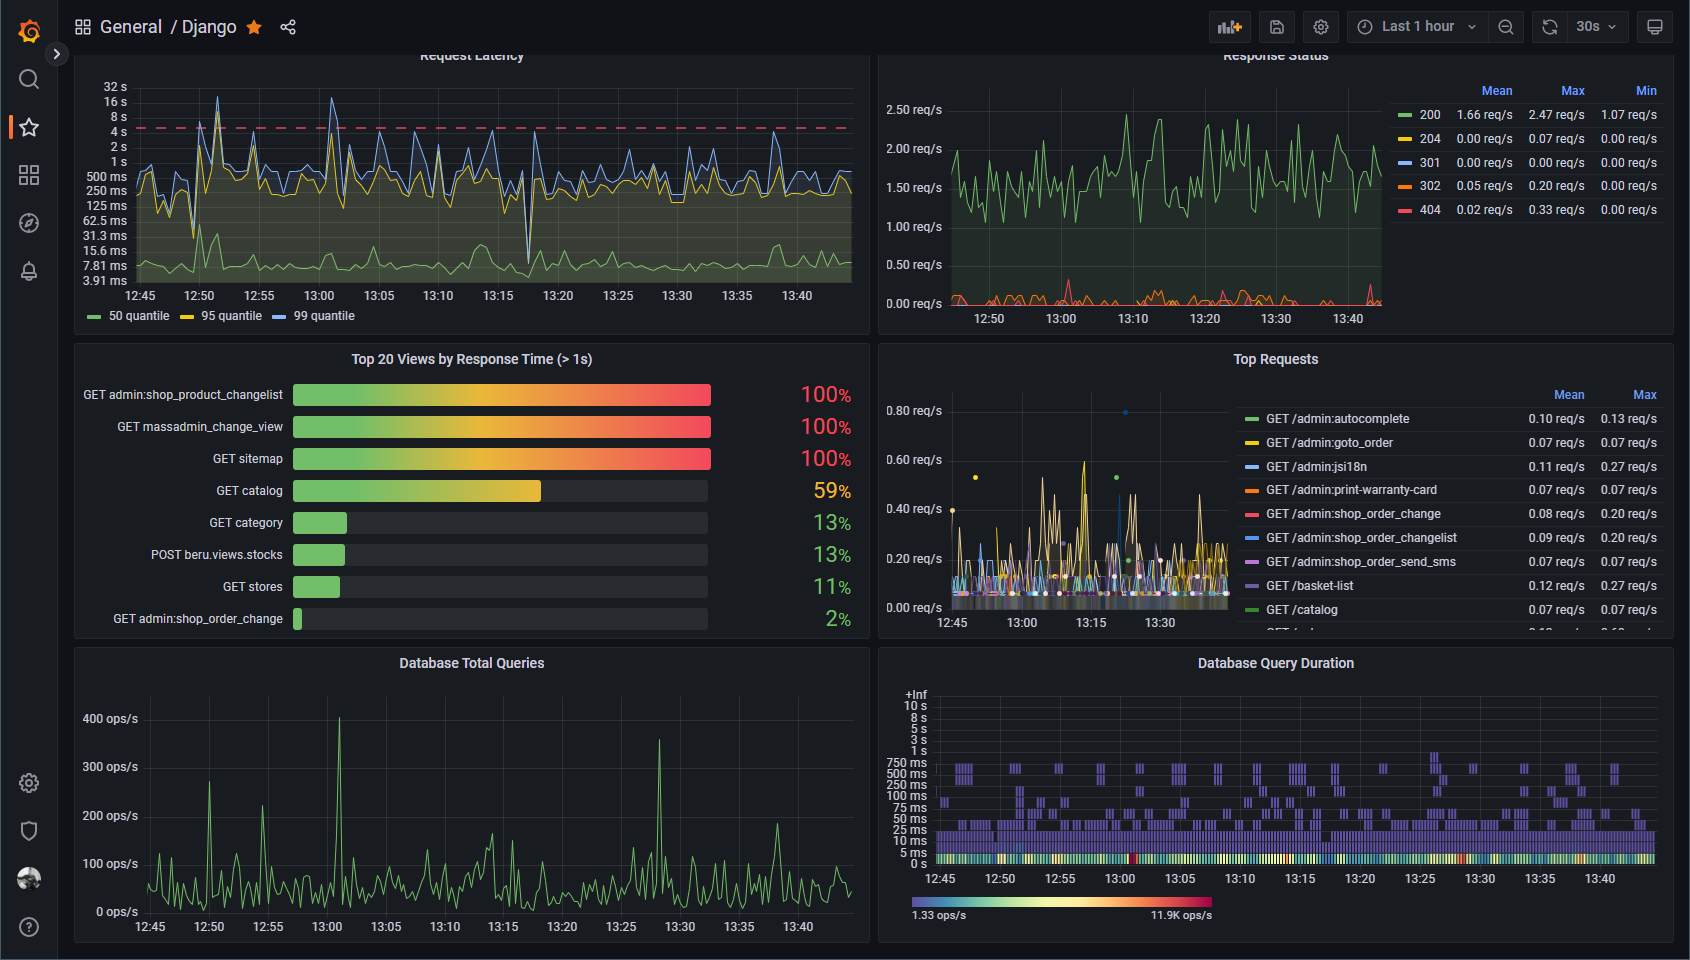
- 添加看板:从 https://grafana.com/grafana/dashboards/17658-django/ import 即可。
截图